


RECENT STORIES
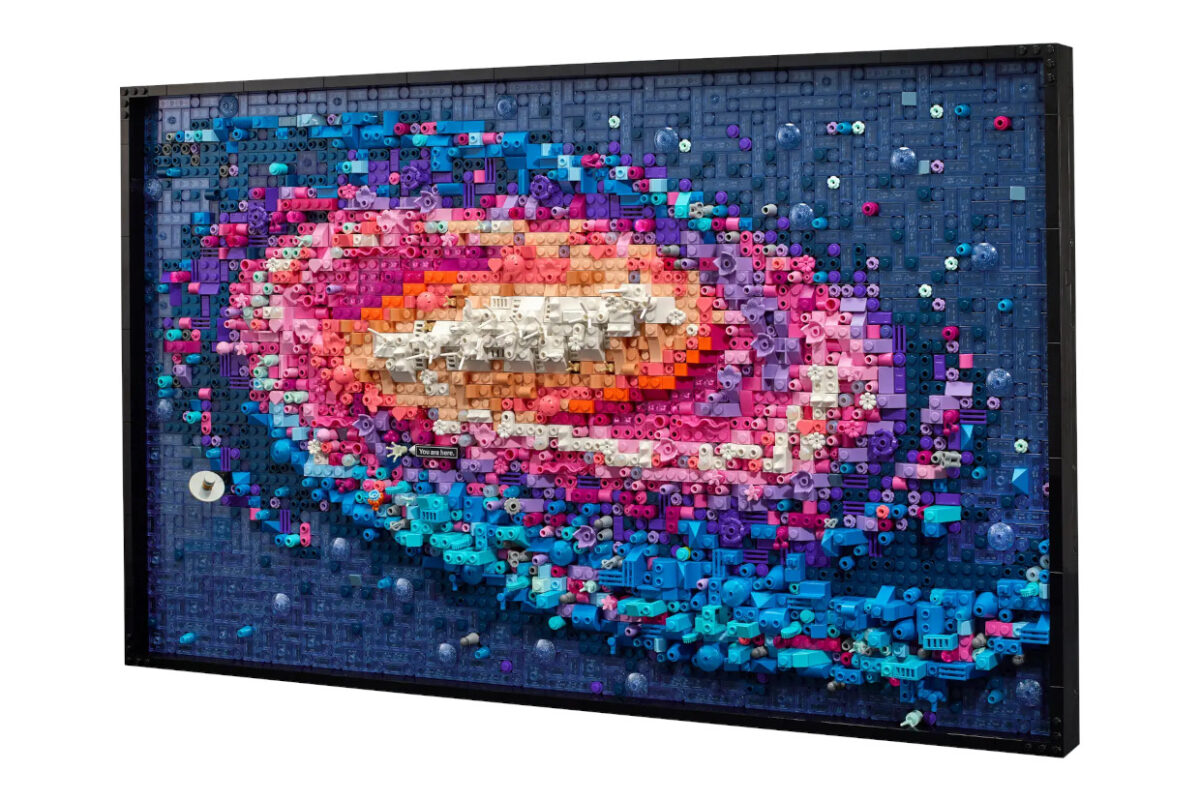
LEGO Art Milky Way Galaxy: Build The Galaxy On Your Wall
The Milky Way Galaxy is the latest addition to LEGO’s Art series and consists of a 3,091-piece replica of the Milky Way Galaxy as imagined from distant space. And it’s not flat either. The hangable wall art relies on numerous unusual LEGO pieces to give it some depth…

15 Ways to Supercharge Your Retirement Savings in Just 5 Years
Five years might not seem like a long time to ramp up your retirement savings, but you can significantly impact your finances with a…

15 Luxury Brands That People Swear By
Luxury is all about showing off how fancy and elegant you are. It’s like saying, “Hey, look at me — I’ve made it!” And…

Avoid Buyer’s Remorse: 15 Key Inspections Before You Buy a Used Car
For millions of car shoppers, buying a used car is the best way to save money on a vehicle. Unfortunately, finding the perfect used…

Great Movie Quotes That Instantly Give Away The Film
Great movies and great quotes go hand in hand. They become a part of its marketing campaign and can have a lasting impact, even…

Beautiful Musical Performances That Will Make Anyone Emotional
Music has the power to transport us back to lost loves, first meetings, and happy moments. Some artists are able to enhance those emotions…

The 13 Voices We’d Love to Narrate Our Lives
Some voices are so soothing and intoxicating that we’d listen to them read the phone book. Some actors could make these obsolete things, such…

Once Acceptable Things That Are Now Very Inappropriate
As time changes, customs also change. Things that people once did routinely are now frowned upon. It’s not necessarily that they were misbehaving before;…